
Fleet tire budget: assumptions, scenarios and risks
 Diego Paludo 6 min read
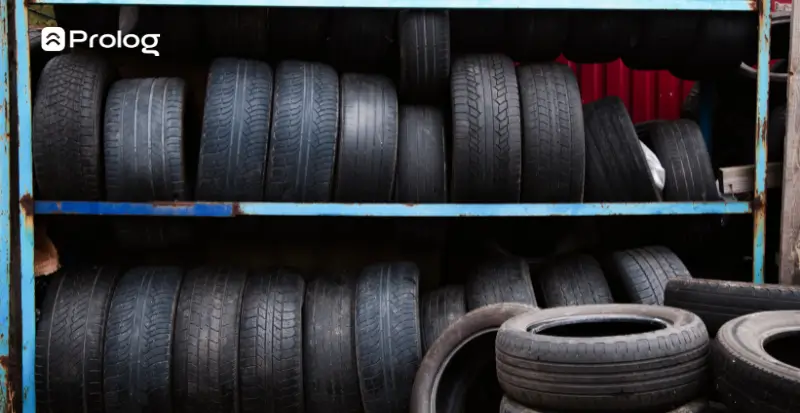
Planning a fleet tire budget for operations with 50 or more vehicles requires handling variables that move simultaneously: projected mileage, fleet composition, retreading policy, market prices, exchange rates and import tariffs.
This calculation has many inputs, and the precision of the result depends directly on the quality of the data available to the operation.
Read on to learn:
- Why tire budgets deserve dedicated attention
- The assumptions behind any tire budget
- How to build conservative, realistic and optimistic scenarios
- The main risks that undermine the budget
- What separates a “guess” budget from a data-based budget
Why tire budgets deserve dedicated attention
In many transport companies, tire cost enters the general maintenance budget as an aggregated line. It is treated as part of the whole, without its own breakdown. Yet tires have financial dynamics different from any other maintenance item.
They are assets with a long, predictable life cycle (when managed), involve retreading decisions that significantly change tire cost per km, are subject to market price changes beyond operational control and represent approximately 10% to 20% of fleet operating costs.
An item with this financial significance and this many variables deserves its own place in truck fleet budget planning.
Separating the tire budget makes it clear how much you plan to spend, how much you actually spend and where the difference lies. Without this separation, deviations disappear into the overall maintenance total and managers lose the ability to identify and correct waste.
The assumptions behind any tire budget
Planning a fleet tire budget starts with a set of assumptions. If they are wrong or outdated, the budget is compromised from the outset, regardless of the model's sophistication.
Understanding how to calculate annual tire expenditure starts by mapping these variables:
Fleet composition and size
How many vehicles, which types (Brazilian configurations such as truck, a rigid truck; semi-trailer combinations; and bitrem, a twin semi-trailer combination) and how many tires per configuration. In tire management for a fleet of 50 vehicles, for example, a fleet in the truck class means 500 active tires; with semi-trailers, it can exceed 1,100.
The calculation base changes with the composition.
Average annual mileage per vehicle
This is the multiplier for everything. A fleet that travels 10,000 km/month per vehicle has completely different replacement needs from one that travels 7,000. The average also needs segmentation: using a general average for vehicles with different driving profiles will distort the projection.
Expected tire useful life
The market reference for fleets without structured management is around 80,000 km. With active, structured fleet tire management, useful life can reach 100,000 or 120,000 km. The useful life assumption defines replacement frequency and, consequently, purchase volume.
Retreading policy
How many retreads per casing can the operation use? What is the average cost per retread? A well-managed casing can go through up to three cycles, and each retread costs a fraction of a new tire.
Retreading policy is one of the biggest cost-reduction levers in the budget and one of the most underestimated.
Average purchase price
In Brazil, truck tire prices start at approximately R$2,200, varying by make, application and supplier. Premium tires can exceed R$3,000. The reference price should consider the mix actually used by the operation, rather than just the available purchasing catalog.
Premature disposal history
What percentage of tires leave the fleet before reaching their expected useful life? If the operation lacks this data, that is a warning sign in itself, because it means one of the biggest sources of budget deviation is not being kept track of.
Each assumption is a cog in the budget. If one is unrealistic, the final planned figure will never be achieved.
How to build conservative, realistic and optimistic scenarios
No budget survives a whole year without variation. Working with scenarios is therefore more useful than betting on a single number. Three well-built scenarios give managers a working range and executives a view of risk.
1) Conservative scenario
This assumes the least favorable plausible conditions. Tire useful life at the low end (around 80,000 km), an above-average premature disposal rate, fewer retreads put to use and an allowance for higher purchase prices.
This allowance is not hypothetical. Brazil's truck tire market faces constant tariff pressure. In 2024, for example, proposals to increase the truck tire import tax by 16% to 25% circulated at Camex, Brazil's Foreign Trade Chamber, resulting from a dispute between domestic manufacturers (represented by ANIP, Brazil's national tire industry association) and importers (represented by ABIDIP, Brazil's tire importer and distributor association).
Even if not every proposal materializes, the risk of higher prices is real and needs to be included in the conservative scenario.
2) Realistic scenario
This uses the operation's own historical averages, such as actual average useful life, effective retreading rate and average purchase price over the last 12 months, adjusted for inflation, and a mileage projection based on the year's operational plan.
This is the scenario used in the transport company's annual fleet budget, and its quality depends entirely on historical data quality. If the fleet has CPK per tire, a retreading rate by period and disposal history by cause, the realistic scenario is precise. Otherwise, it is an estimate by another name.
3) Optimistic scenario
This assumes the operation will improve management over the year. Useful life extended by 15% to 20% through better calibration and rotation processes, a 10% to 15% reduction in premature disposal and a higher retreading approval rate.
The optimistic scenario is the target, showing the potential return on process and technology investments. If the difference between realistic and optimistic scenarios is R$200 thousand, that is the amount improved management can return to the operation's results.
The main risks that undermine the budget
Even with well-built scenarios, some risks can break the budget. Knowing them does not necessarily eliminate their impact, but allows you to prepare responses before a deviation becomes irreversible.
Some of the main risks are:
- market price changes;
- lack of reliable historical data;
- premature disposal that is not kept track of;
- operational seasonality;
- absence of a retreading policy;
Some of these risks have already appeared in the assumptions and scenarios above. Two deserve additional attention here:
Truck tire prices in Brazil are under pressure from exchange rates (a large share of inputs is imported) and tariff disputes between domestic manufacturers and importers. Purchase price fluctuations of 10% to 20% over a year are not uncommon. If a budget assumes a fixed price with no allowance, any increase upsets the projection.
Fleets with operational peaks at certain times of year (agricultural harvests, holidays or seasonal contracts) also experience concentrated wear. If the budget is spread evenly over 12 months, concentrated demand in certain quarters can cause inventory shortages or emergency purchases at higher prices.
What separates a “guess” budget from a data-based budget
The difference between a generic budget and a reliable one comes down to one question: does the fleet have tire CPK calculated for each asset?
Those with CPK know how much each tire cost per kilometer traveled. They know which make performed best in the operation. They know which vehicles have outlying tire costs. They know how many tires were disposed of prematurely and why.
With this information, the annual projection stops being an estimate and becomes a calculation supported by actual operational data.
Those without CPK work with market averages and supplier estimates, along with some guesswork from the team and the operation's manager. This information is important too, but insufficient for decision-making.
Want your fleet's data to support your operation's tire budget? Discover how Prolog Tire Management organizes CPK, individual tire history and your fleet's projections.
Frequently asked questions
How do you calculate annual fleet tire expenditure?
What is the useful life of a truck tire?
How much does a truck tire cost?
How do you build tire budget scenarios?
What risks undermine the tire budget?
What separates a data-based tire budget from a guess?
// newsletter
Fleet management content, straight to your inbox
Articles on tires, maintenance and fleet operations. No spam.