
How to measure and analyze your fleet management results
 Jade Zart 5 min read
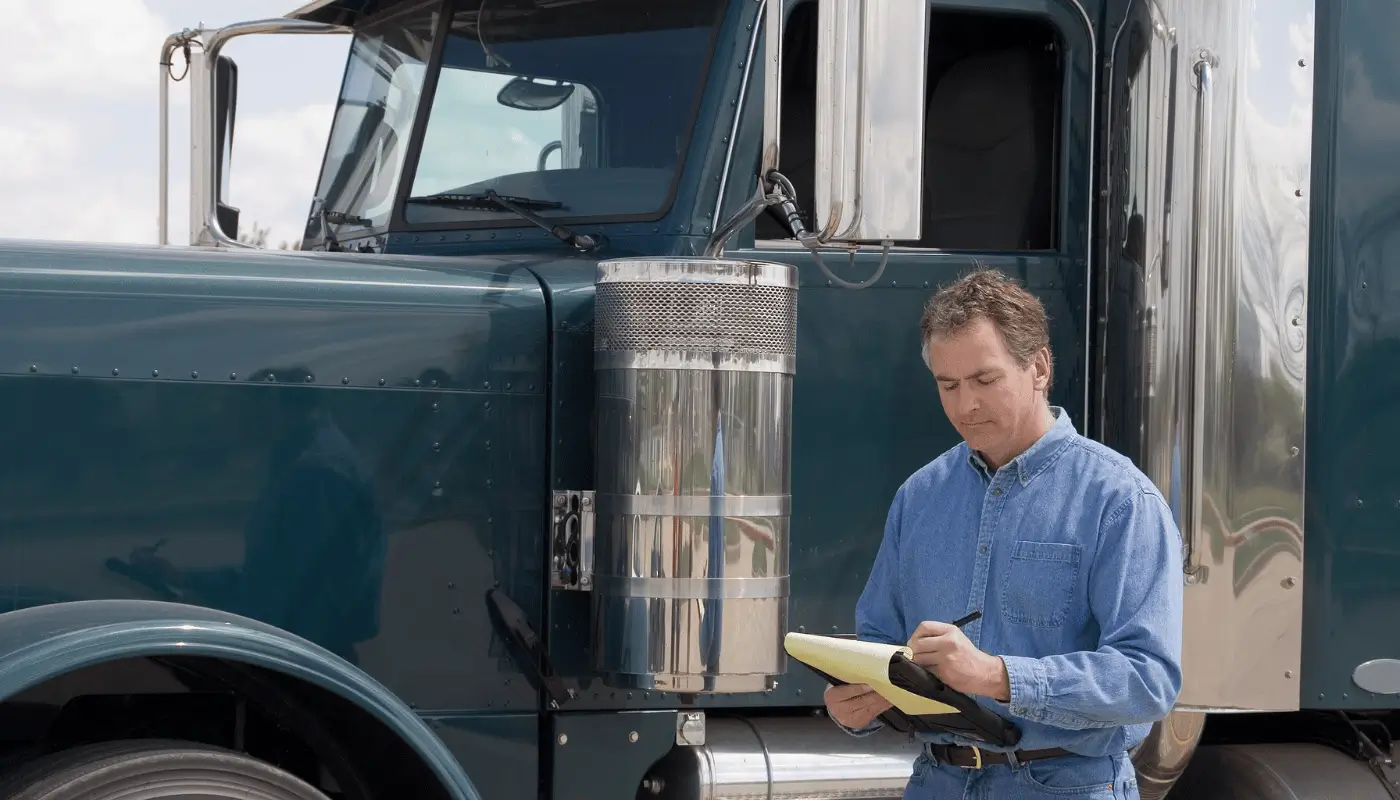
An efficient fleet has not only costs under control, but also good safety and operational efficiency. To reach this level of excellence, you need to keep track of fleet management results.
By identifying and monitoring key performance indicators, you can detect problems before they become critical and implement effective strategies to optimize the operation.
Read on:
- Why measuring fleet management results matters
- How to measure fleet management results
- Which indicators are essential for good fleet management
- Which results to measure
- How to improve fleet management
Why is measuring fleet management results important?
Measuring fleet management results is essential to ensure operational efficiency, cost reduction and informed decision-making.
Measuring and monitoring performance indicators helps identify improvement opportunities in different management areas and detect problems before they become critical.
This makes it possible to implement solutions and strategies aimed at optimizing fleet operation.
Measuring results is also fundamental to financial management. Knowing where the main expenses are and why they are below or above an established average allows managers to allocate available resources more effectively.
How can fleet management results be measured?
Measuring fleet management results is a process that requires collecting and analyzing relevant data, using key performance indicators (KPIs) and implementing appropriate tools and practices. Take a look:
Defining performance indicators
Defining key performance indicators (KPIs) is the first step in measuring fleet management results, because without them you lack direction on what to assess.
Some of the most common KPIs are cost per kilometer traveled, availability rate, fuel consumption per kilometer, the number of preventive versus corrective maintenance jobs, and average downtime.
Data collection
It is important to use highly accurate tools and systems for this data collection stage. Vehicle information, such as maintenance services performed, average fuel consumption and average tire wear, can be decisive for your decisions.
Data collection should be continuous and comprehensive, ensuring that all the most relevant information is monitored for a complete analysis.
Organizing and interpreting the most relevant data
After collecting the data, the next step is organizing and interpreting the most relevant information. This can include creating reports, charts and dashboards that make trends and patterns easier to visualize.
Correct interpretation at this stage makes it possible to identify improvement areas and understand the fleet's current performance against the established KPIs.
You can use data analysis tools to make this task easier.
Generating hypotheses and identifying improvement opportunities
With data organized and interpreted, it is time to generate hypotheses and identify improvement opportunities. Analyze the insights obtained to identify possible causes of inefficiencies and areas that can be optimized.
For example, if fuel consumption is above average, it may be necessary to review drivers' driving practices or vehicle maintenance.
Hypothesis generation, like data collection, should be a continuous process to help implement practical solutions and continually improve your fleet management.
Which indicators are essential for good fleet management?
There is a wide variety of indicators you can use, and the main ones may vary with each fleet manager's objectives. But to give you a starting point, some of the most common and widely used are:
Cost per kilometer traveled
This indicator calculates the total cost of fleet operation divided by total mileage traveled. It helps identify which vehicles have above-average costs, allowing individual investigation of possible problems and mechanical failures.
Availability rate
The availability rate measures the percentage of time vehicles are available for use relative to total time. A high availability rate indicates a well-maintained, efficient fleet, while a low rate may signal maintenance or management problems.
Number of preventive versus corrective maintenance jobs
Comparing the number of preventive (planned) and corrective (unplanned) maintenance jobs makes it possible to assess fleet maintenance management.
A high proportion of corrective maintenance can indicate planning failures and result in higher operating costs as well as more downtime.
By contrast, a greater number of preventive actions indicates that fleet vehicles are generally compliant.
Average fuel consumption
By monitoring average fuel consumption, it is possible to identify vehicles consuming more than expected, as well as driving practices that can be optimized.
Maintenance per vehicle
Monitoring maintenance frequency, costs and types of maintenance per vehicle makes it possible to identify which vehicles require more attention and resources. This allows you to detect wear patterns and schedule preventive maintenance more effectively.
Maintenance per driver
Assessing the relationship between specific drivers and maintenance needs can reveal usage patterns that affect vehicle condition.
Drivers who constantly operate vehicles needing maintenance may need additional training in safe, economical driving techniques or even related penalties.
Average fleet age
Average fleet age is an important indicator for planning vehicle replacement. Fleets with older vehicles tend to have higher maintenance costs and a greater risk of failures.
Which fleet management results should be measured?
Operational efficiency
Operational efficiency represents a company's ability to deliver its services while making the best possible use of its resources.
Indicators such as fuel consumption and vehicle utilization rate are used to assess this aspect of your management.
Operating costs
Operating costs include all expenses associated with fleet maintenance and operation. In this case, indicators such as cost per kilometer traveled and maintenance costs should be closely monitored.
This makes it possible to identify areas increasing your costs and opportunities to reduce them without harming fleet operation.
Fleet safety
Fleet safety covers both drivers on the road and operational processes for handling equipment and cargo.
This means you need to keep track of and manage operational risks, as well as continually seek training and development for the team.
Return on investment (ROI)
ROI should consider the costs of implementing new technologies, training and maintenance compared with the benefits obtained, such as reduced operating costs, increased efficiency and improved safety.
A positive ROI indicates that investments are delivering beneficial results, while a negative ROI may signal the need to reassess strategies.
Assessing this fleet management result helps make more informed decisions about future investments and adjustments.
How can fleet management be improved?
Improving fleet management involves applying different — but complementary — strategies. The first and main step is to structure each specific area, such as tire management, maintenance management, document management and so on.
Having the structure defined and standardized processes established for each area already takes you a good part of the way toward optimizing your fleet management results.
In addition, implementing digital tools and management software is also indispensable for achieving more positive results.
Start by getting to know Prolog's solutions, which focus 100% on optimizing transport fleet management. Schedule your free demonstration.
Frequently asked questions
I do not know which figures to keep track of in my fleet. Where do I start?
How can a fleet's cost per kilometer be controlled?
What does the ratio of preventive to corrective maintenance say about the operation?
My fleet's fuel consumption has increased. What should I investigate first?
How do I know whether investment in fleet technology has paid off?
I have collected fleet data, but I do not know what to do with it. What now?
// newsletter
Fleet management content, straight to your inbox
Articles on tires, maintenance and fleet operations. No spam.