Fleet management dashboard: 8 KPIs that matter
 Jean Zart 11 min read
You have probably heard that “what gets measured gets managed”, right? In a fleet's routine, this is even more true. After all, there are so many vehicles, data points and processes happening at the same time that, without organization and a clear view of the information, the manager ends up spending more time putting out fires than actually optimizing the operation.
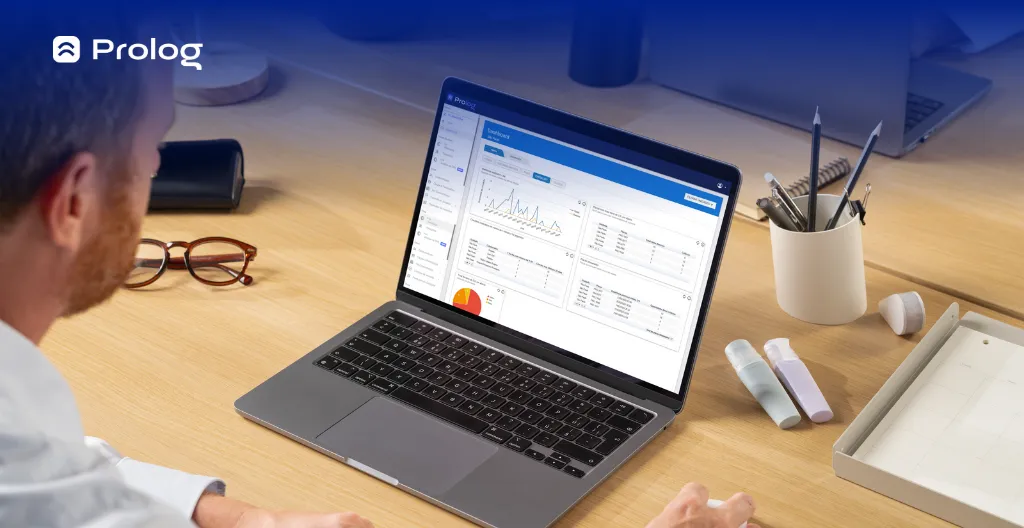
That is why the fleet management dashboard has been gaining ground in the market: it brings together, in one place, the main indicators of your operation, in a visual and easy-to-interpret way. And more important than having the data is knowing what to do with it.
In this article, you will understand how dashboards work, which KPIs cannot be missing, how to apply them in practice and, of course, how technology can make this whole process easier. Check out the topics:
- What is a fleet management dashboard?
- Which indicators (KPIs) can't be missing from your dashboard?
- 6 benefits of using fleet management dashboards
- How to use fleet management dashboards day to day?
- Optimize fleet management with Prolog's dashboards
What is a fleet management dashboard?
A fleet management dashboard is a visual tool that concentrates the operation's main data in one place. In other words, it is your control panel, where you can see everything that is happening with the fleet — without having to open a thousand spreadsheets.
The great advantage of the dashboard is turning information into strategy. Instead of just seeing that a tire was changed, you can notice that it was replaced too early. Or you can notice that the cost per kilometer has gone up over the last few weeks and understand where this is happening.
With it, the fleet manager leaves reactive mode — the one that only deals with pending issues every day — and starts acting strategically, with data-driven management based on real, up-to-date information.
Which indicators (KPIs) can't be missing from your dashboard?
A good fleet management dashboard goes far beyond loose numbers: it uses data intelligence to provide strategic indicators — those that reveal the real health of the operation and show where the bottlenecks are, such as CPK, the ratio between corrective and preventive maintenance, MTTR and much more.
Below are the main KPIs (key performance indicators) that cannot be missing from the routine of anyone seeking efficiency, control and growth:
1. Fleet availability
This indicator measures how many vehicles in the fleet are available to run safely. It takes into account vehicles stopped for maintenance, damage or other operational reasons. When availability is low, there is a risk of delays and lost revenue.
Keeping a close eye on fleet availability helps the manager make quick decisions — such as redistributing routes, prioritizing maintenance or reinforcing the planning of backup vehicles. It is an essential indicator for keeping the operation flowing and productivity high.
2. Cost per kilometer (CPK)
CPK calculates how much the fleet is spending, on average, for each kilometer driven. The calculation includes costs for fuel, maintenance, tires, tolls and even administrative costs related to the vehicles. It is one of the most important KPIs for measuring the operation's financial efficiency.
When the cost per kilometer goes up, it is a sign that something needs adjusting: too much corrective maintenance, poorly planned routes, aggressive driving or even tires with incorrect calibration. A well-configured dashboard lets you follow this number by vehicle, route or period.
3. Ratio between corrective and preventive maintenance
This indicator shows the balance (or imbalance) between planned and emergency maintenance. The higher the volume of corrective work, the greater the risk of serious failures, delays and unexpected costs. Well-executed preventive maintenance, on the other hand, prevents unscheduled downtime and extends the useful life of assets.
The TPM (Total Productive Maintenance) methodology helps create a culture of continuous care for vehicles, encouraging regular inspections and scheduled interventions. It is not the name of the index, but it can support the routine that improves this ratio on the dashboard and shows whether fleet management is truly preventive.
4. Fleet utilization rate
This KPI measures the percentage of time a vehicle is in operation during a given period. A fleet with high idle time represents cost without return — stopped vehicles keep generating expenses even when they are not running.
With this data, you can identify underused vehicles, adjust usage schedules and even assess whether it is time to sell or reallocate assets. A good dashboard shows utilization by vehicle and by period, making it easier to redistribute resources.
5. MTTR – Mean Time to Repair
MTTR calculates the average time it takes for a vehicle to be repaired and return to operation after a failure or maintenance. The shorter this time, the more efficient the maintenance process — and the smaller the impact of the downtime on the operation.
Following this indicator on the dashboard helps measure the technical team's speed and identify bottlenecks in the workshop's workflow. A high time can point to missing parts, poor communication or low productivity in the maintenance department.
6. MTBF – Mean Time Between Failures
This KPI measures the average time a vehicle runs between one failure and the next. It is essential for assessing the reliability of the fleet and of the maintenance performed. A high MTBF indicates that vehicles are running well for longer, with fewer interruptions.
When MTBF starts to drop, it may be a sign that maintenance is not being carried out properly, or that the fleet is aging and requiring more attention. Following this data lets you act before failures become frequent (and expensive).
7. Average fuel consumption
This indicator shows how much each vehicle is consuming in liters per kilometer — and it can be broken down by type of route, driver or truck model. Fuel is one of the fleet's biggest costs, and even small variations make a big difference at the end of the month.
Deviations in consumption can point to mechanical problems, poor driving or even refueling outside the standard. A dashboard with this KPI makes it easier to investigate anomalies and supports internal fuel-efficient driving campaigns.
8. Operational incident history
Traffic fines, damage, delays, checklist failures or driver reports. These events help you understand where the points of attention are in the operation — whether in maintenance, driving, route planning or document control.
Having this history visible on the dashboard lets you act with focus, avoiding repeat occurrences and driving process improvements. In addition, this data can be used to train teams and strengthen a culture of operational accountability.
6 benefits of using fleet management dashboards
If you deal with dozens (or hundreds) of data points every day and feel they are not helping your decision-making, the dashboard may be the turning point you were missing.
It is not about having more numbers — it is about seeing clearly what is working, what needs attention, and acting fast. Here are the main benefits a good dashboard can bring:
1. A clear view of day-to-day operations
The dashboard concentrates all the fleet's essential data in one place, updated as the operation records new information. With it, the manager quickly sees the status of each vehicle, open work orders, consumption indicators and any warning sign that requires immediate action.
2. Lower operating costs
By identifying patterns of waste — such as excess fuel use, premature tire wear or too much corrective maintenance — the dashboard helps you make smarter decisions, avoiding losses and increasing efficiency.
3. More control over fleet maintenance
By following indicators such as MTTR and MTBF, you understand whether maintenance is being done at the right time and which vehicles require more attention. This lets you act preventively, avoiding unexpected downtime and extending the useful life of assets.
4. Team productivity at your fingertips
With dashboards that show productivity, the number of WOs resolved, average time per job and other performance metrics, the manager has a stronger basis for recognizing good results, guiding improvements and avoiding overload.
5. More efficient communication between departments
When all teams see the same data — operations, maintenance, management and even administration and finance — alignment improves. Reports stop being questioned and start guiding collective decisions, based on facts rather than guesswork.
6. Easier audits and traceability
By bringing together inspection history, checklist data and work orders in a single system, the dashboard makes it easier to trace failures and speeds up audit processes, both internal and external.
How to use fleet management dashboards day to day?
The dashboard is not just another screen with charts — it is a strategic tool. But for it to really work in the day-to-day operation, you need more than just access to the data.
The ideal is to integrate this control panel into the team's routine, with well-defined processes, clear responsibility and the support of a good management tool.
Here is how to put this into practice:
Start with the right tool (and with the people who will use it)
The first step to using a dashboard efficiently is having a system that truly captures your operation's data — such as Prolog's Tire Management, Maintenance Management and Electronic Checklist solutions. With these tools in use, the information recorded by the team is organized on the dashboard for consultation and analysis.
Another essential point is defining who will be responsible for following the data day to day. It can be the fleet manager or an assistant trained for this role. What matters is that this person knows how to interpret the indicators, identifies patterns and knows when to flag something out of the ordinary.
Use the dashboard as your first source of information each day
Before making any decision or releasing vehicles, check the dashboard: which WOs are open? Which vehicles are available? Did any checklist item fail? This first contact with the data helps avoid surprises right at the start of the shift.
Bring data into the conversation
Alignment meetings become much more productive when they are based on real data. Instead of assumptions or guesswork, use the dashboard to show what is happening and make better decisions easier.
Follow the team's performance indicators
Besides looking at the vehicles, also look at the team's performance. How many work orders is each mechanic resolving? Which items show the most failures in checklists? This data helps you target training, recognize results and correct what needs adjusting.
Use reports to support bigger decisions
When you need to justify an early tire replacement, a longer stop or a new investment, dashboards provide reports and history that back up your decisions. This strengthens your case with the board, customers and partners.
Optimize fleet management with Prolog's dashboards
If you have made it this far, you already understand that a good dashboard is not just a “bonus” — it is an essential tool for keeping the fleet under control. But knowing what needs to be followed is of little use if the data is scattered, outdated or hard to access.
That is why Prolog's solutions were designed to make the fleet manager's routine easier. The Tire Management, Electronic Checklist and Maintenance Management tools feed the dashboards with the records made in the operation. In other words: the data you need stays organized and visually clear so you can follow the routine.
Here is what you can follow with Prolog's dashboards:
- Number of work orders generated
- Open work orders and average resolution time
- The tires that require correction
- Position of the tires in your fleet
- Cost per kilometer (CPK) and average tire wear per km
- Items with the highest number of failures in checklists
- Average productivity per mechanic
- Vehicles with the most failed inspections and the highest unavailability
In addition, you can upload up to 10 files per WO — such as quotes, invoices, photos and technical reports — directly into the system. This makes traceability easier and speeds up audits, both internal and external.
Another highlight is the integration with other systems you already use day to day. Prolog offers APIs that connect the dashboards to the main platforms on the market, such as Totvs, Praxio, Power BI, Qlik, among others.
And if any question comes up, Prolog's support is ready to help you — with fast, close service that understands the reality of freight transport.
All of this helps your operation gain efficiency, your team gain autonomy and you, the manager, gain the clarity to make strategic decisions with confidence.
Ready to take the next step? Download our free spreadsheets for tire control and maintenance and start turning your data into concrete results.
Frequently asked questions
Which KPIs should every fleet dashboard include?
What does CPK reveal about the operation?
What is the difference between MTTR and MTBF?
How do you fit the dashboard into the team's routine?
What can you follow in Prolog's dashboards?
Does the dashboard integrate with the systems I already use?
// newsletter
Fleet management content, straight to your inbox
Articles on tires, maintenance and fleet operations. No spam.